- Traffic Safety
- Best Practices
- Archive of Master Trainer Spotlights
- Archive of Board Member Profiles
Similar to 2023, the national number of alcohol-impaired crash fatalities decreased in 2024. The 11,904 fatalities was a 3.9% decrease from the 12,382 alcohol-impaired deaths in 2023.
The chart below shows the five-year history for total and alcohol-impaired-driving traffic fatalities.
|
2024 |
2023 |
2022 |
2021 |
2020 |
| Total Fatalities |
39,254 |
41,045 |
42,721 |
43,230 |
38,824 |
| Alcohol-Impaired Fatalities |
11,904 |
12,382 |
13,458 |
13,617 |
11,727 |
| % Change in Alcohol-Impaired Fatalities |
-3.9% |
-7.6% |
-1.2% |
+16.1% |
+15.0% |

The chart below shows the five-year history for total and alcohol-impaired-driving traffic fatalities.
|
2020 |
2021 |
2022 |
2023 |
| Total Fatalities |
38,824 |
43,230 |
42,721 |
40,901 |
| Alcohol-Impaired Fatalities |
11,727 |
13,617 |
13,458 |
12,429 |
| Percentage Change in Alcohol-Impaired Fatalities |
+15.0% |
+16.1% |
-1.2% |
-7.6% |
Similar to 2022, the national number of alcohol-impaired crash fatalities decreased in 2023. The 12,429 fatalities was a 7.6% decrease from the 13,458 alcohol-impaired deaths in 2022.
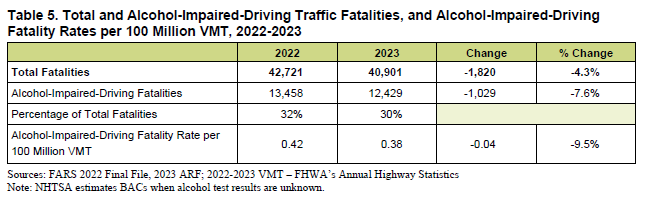
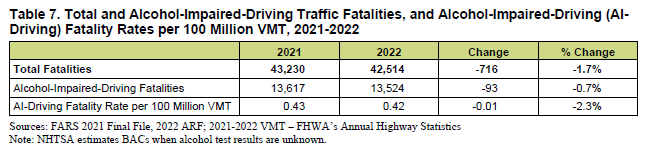
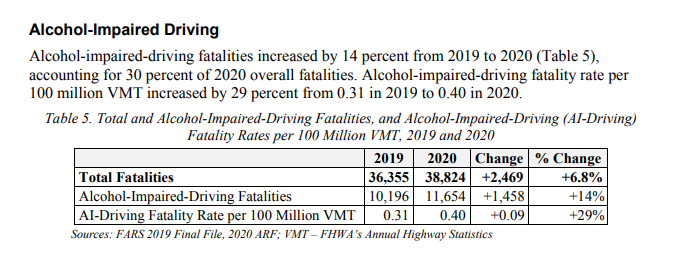
The significant spikes in both alcohol-impaired fatalities and the fatality rate per 100 million vehicle miles traveled observed in 2020 continued to a lesser degree in 2021. Finally, in 2022 there were decreases (although slight) in both measures.
The chart below shows the five-year history for total and alcohol-impaired-driving traffic fatalities.
|
2019 |
2020 |
2021 |
2022 |
| Total Fatalities |
36,355 |
38,824 |
43,230 |
42,721 |
| Alcohol-Impaired Fatalities |
10,196 |
11,727 |
13,617 |
13,458 |
| Percentage Change in Alcohol-Impaired Fatalities |
-4.8% |
+15.0% |
+16.1% |
-1.2% |

The chart below shows the five-year history for total and alcohol-impaired-driving traffic fatalities.
|
2018 |
2019 |
2020 |
2021 |
| Total Fatalities |
36,835 |
36,355 |
38,824 |
43,230 |
| Alcohol-Impaired Fatalities |
10,710 |
10,196 |
11,727 |
13,617 |
| Percentage Change in Alcohol-Impaired Fatalities |
-1.6% |
-4.8% |
+15.0% |
+16.1% |
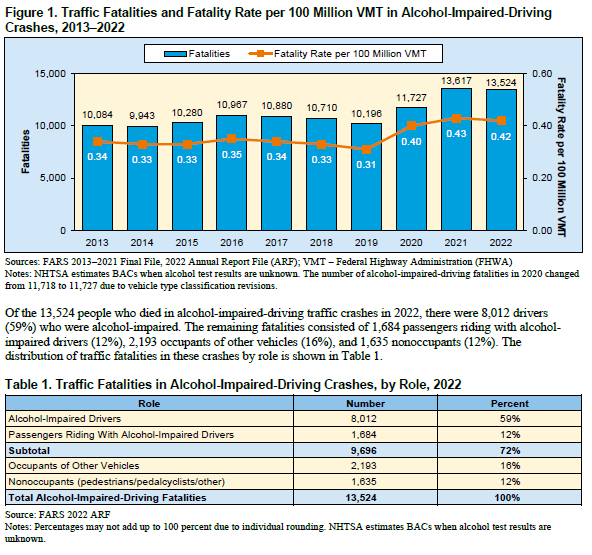
- In 2021 there were 13,384 fatalities in motor vehicle traffic crashes in which at least one driver was alcohol-impaired. This represented 31 percent of all traffic fatalities in the United States for the year.
- Fatalities in alcohol-impaired-driving crashes increased by 14.2 percent (11,718 to 13,384 fatalities) from 2020 to 2021.
- One alcohol-impaired-driving fatality occurred every 39 minutes in 2021, on average.
The chart below shows the five-year history for total and alcohol-impaired-driving traffic fatalities.
|
2017 |
2018 |
2019 |
2020 |
| Total Fatalities |
37,473 |
36,835 |
36,355 |
38,824 |
| Alcohol-Impaired Fatalities |
10,880 |
10,710 |
10,196 |
11,727 |
| Percentage Change in Alcohol-Impaired Fatalities |
-0.8% |
-1.6% |
-4.8% |
+15.0% |
March 26, 2021, National District Attorneys Association (NDAA)
Importance of rideshare
Rideshare services, more now than ever, offer an affordable, convenient, and accessible alternative, and riders are responding in a positive way. An annual economic survey conducted by Lyft, found that 71 percent of riders reported they are less likely to drive substance-impaired due to the availability of Lyft. As previously mentioned, NHTSA has documented that most alcohol impaired driving fatalities occur on nights and weekends, this information aligns with the frequency of Lyft’s reported ride use where the majority of Lyft rides take place outside of commute hours, such as nights and weekends. In addition, according to a recent analysis by Lyft, more Lyft pick-ups and drop-offs occur in areas where entertainment and nightlife establishments occur and during the evening (Hutchinson, 2020). Previously mentioned research by Kurtz showed that pairing marketing and messaging to utilize ride-sharing alternatives to these demographics can reduce the incidence of impaired driving which supports the analysis of data presented in this report.
September 28, 2020, National District Attorneys Association (NDAA)
Importance of rideshare
It is clear that given the option to have a sober ride rather than driving impaired, rideshare offers an affordable, convenient, and accessible alternative. However, the option lies within the driver to do so. In this regard, an annual economic survey conducted by Lyft, found that 71% of riders reported they are less likely to drive substance-impaired due to the availability of Lyft. As previously mentioned, NHTSA has documented that most alcohol impaired driving fatalities occur on nights and weekends, this information aligns with the frequency of Lyft’s reported ride use where the majority of Lyft rides take place outside of commute hours, such as nights and weekends. In addition, according to a recent analysis by Lyft, more Lyft pick-ups and drop-offs occur in areas where entertainment and nightlife establishments occur and during the evening (Hutchinson, 2020). It is evident that Lyft has positioned itself as an accessible alternative to driving impaired especially during the days, times, and locations most needed.
“Fatalities in police-reported, alcohol-involved crashes, as a percentage of all fatalities, increased in June (21% [20] versus 20% [19]), August (21% [20] versus 19% [19]), and October and November (18% [20] versus 17% [19]). Total estimated fatalities in police-reported, alcohol-involved crashes increased by 9 percent from 2019 to 2020. This measure is different from NHTSA’s traditional reporting of alcohol impaired-driving crashes, which is based on both reported and imputed blood alcohol concentration (BAC) values. BAC values have a significant reporting lag and will be finalized later this year, which is why this analysis used police-reported alcohol involvement to get an indication of changes from 2019 to 2020.”